- Q
-
Quality Companion 如何在價值流程圖 (Value Stream Map) 計算 Timeline 數據?
- A
-
價值流程圖的計算
價值流程圖 (Value stream maps, VSM) 計算 Timeline、Timeline Summary Box 和 Customer Demand Box 的數據。
Timeline 計算
當您增加資料至流程圖形 (Process shapes) 和庫存圖形 (Inventory shapes),價值流程圖會顯示一個 Timeline。此 Timeline 顯示週期時間 (cycle time) 和庫存 (inventory) 對於您的流程影響。
Inventory Time
庫存圖形 (Inventory shapes) 的 Inventory Time 出現在 Timeline 的凸起部分,如下圖。

Timeline 凸部分
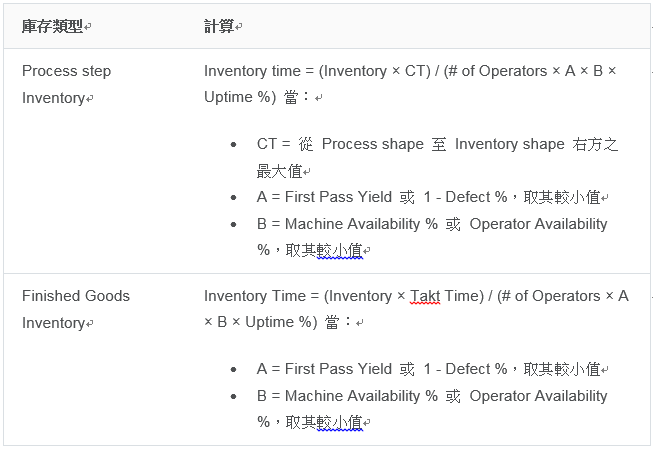
如果您沒有在工作面版 (task pane) 輸入 Inventory Time,則 Timeline 會針對每一個庫存圖形 (Inventory shape) 計算其時間。Timeline 是依圖形所表示的下列庫存類型,計算 Inventory Time。

Cycle Time
流程圖形 (Process shapes) 的Cycle Time 數據出現在 Timeline 的下凹部分,如下圖。Timeline顯示 Cycle Time 在其上方,而下方為 Value Added Cycle Time。

Timeline 凹部分
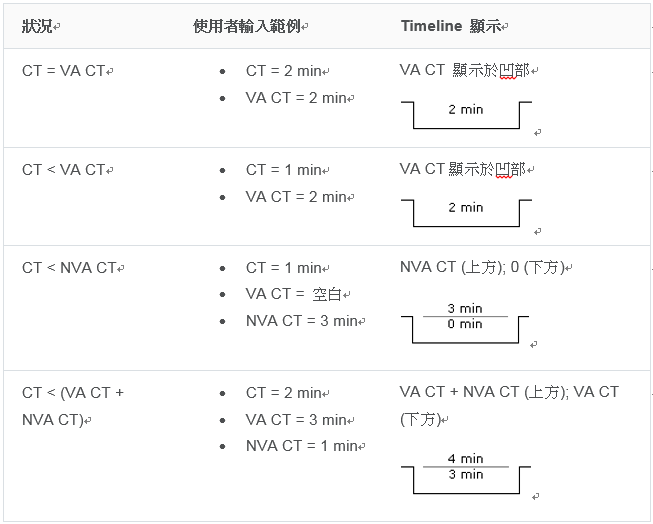
針對每一個流程圖形 (Process shape),您可以輸入 Cycle Time (CT)、Value Added Cycle Time (VA CT) 和 Non-value Added Cycle Time (NVA CT) 的任意組合。價值流程圖依據下列公式,計算其 Cycle Times:
- Cycle Time (CT) = Value Added Cycle Time (VA CT) + Non-value Added Cycle Time (NVA CT)
如果您所輸入的 CT、VA CT 和 NVA CT 數據不符合此公式,價值流程圖將依下列方式,計算並顯示 Cycle Times:

Timeline Summary Box 計算

Timeline Summary Box
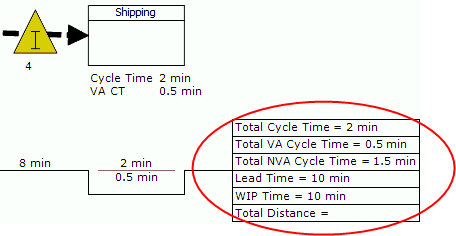
價值流程圖在Timeline Summary Box 維持計算一個 Timeline 數據的總和。Total Cycle Time
Process Shapes 的 Cycle Time 數據加總,包含輸入或經計算的值。
Total VA Cycle Time
Process Shapes 的 Value Added Cycle Time 數據加總,包含輸入或經計算的值。
Total NVA Cycle Time
Process Shapes 的 Non-value Added Cycle Time 數據加總,包含輸入或經計算的值。
Lead Time
Inventory Shapes 的 Inventory Time 數據加總,加上 Process Shapes 的 Cycle Time 數據總和。
WIP Time
Inventory Shapes 的 Inventory Time 數據加總,包含 Raw Materials Inventory 和 Finished Goods Inventory,加上 Process Shapes 的 Cycle Time 數據總和。
Total Distance
Process Shapes 和 Inventory Shapes 的 Distance 數據總和。Customer Demand 和 Takt Time計算
價值流程圖依據您在 Map Calculations 工作面版上的Customer Demand 和 Facility Data所輸入的值,計算 Takt Time。

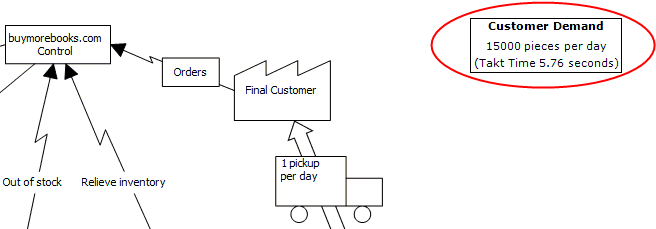
圖上 (VSM) 所示的 Customer Demand 和 Takt Time
Customer Demand 和 Takt Time 出現在價值流程圖的右上方。Customer Demand
客戶在一段特定時間內所要求的產品單位或服務單位的數量。
Takt Time
使用下列公式:
Hours/Day
使用下列公式: